
How to Quantify Migration Risk Before You Flip the Switch
A practical framework to measure migration risk across schema drift, data loss, latency, and continuity, with tests and stakeholder metrics.
1) Surface the risk dimensions and measurable indicators
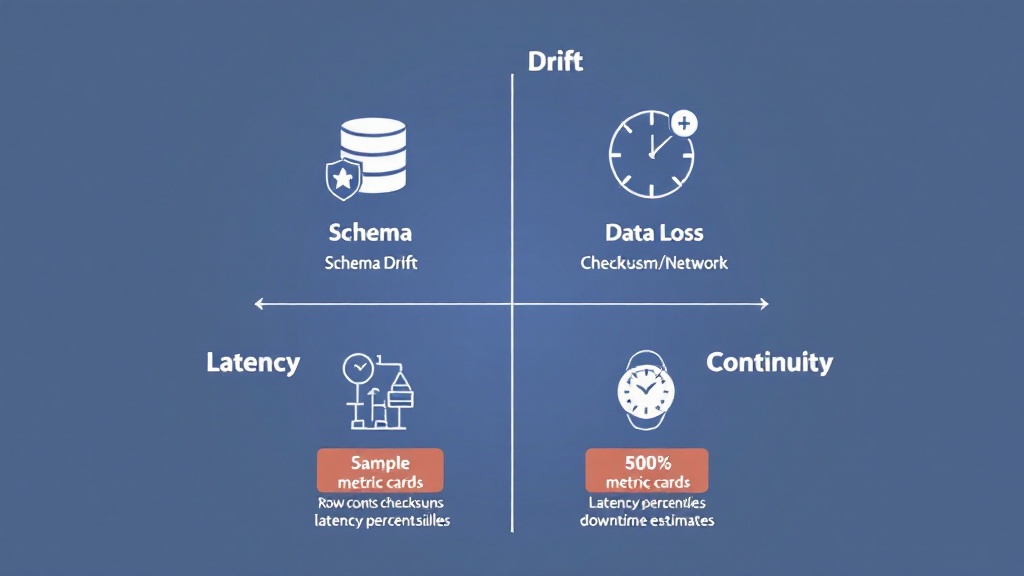
Before you run any job, define the risks that matter to your stakeholders: schema drift, data loss/integrity, replication latency, and business continuity. For each dimension pick 2–3 measurable indicators. For schema drift: number of unmapped columns, incompatible data types, and expected DDL transformations. For data integrity: row count delta, checksum mismatch rate, and percent of rows with null/invalid critical keys. For latency: average CDC lag, 95th percentile lag, and percentage of transactions delayed beyond RTO. For continuity: estimated cutover downtime, rollback window, and the number of dependent downstream jobs.
Turning these into metrics makes risk visible and comparable across projects. Use thresholds (green/yellow/red) tied to business SLAs—e.g., checksum mismatch > 0.01% = yellow, > 0.1% = red. Instrument your pre-production runs to capture these indicators automatically using lightweight tools: schema analyzers for drift, row-level checksums for integrity, CDC probes for latency, and a simulated cutover to measure downtime and rollback time. This is the foundation of any data migration risk assessment and an essential part of a repeatable runbook for migration teams.
2) Lightweight pre-production tests that expose real risk

Run a small set of fast, repeatable tests in pre-production that surface the highest-impact failures. Start with schema analysis and DDL preview: validate that suggested mappings convert types and constraints correctly and flag fields requiring transformation. Next, perform a dry-run bulk copy with sampling—compare row counts and column-level checksums on sampled partitions to detect silent data loss or transformation bugs. Add a targeted CDC soak test: replay a representative transaction workload (inserts/updates/deletes) and measure end-to-end lag, ordering anomalies, and tombstone handling.
Complement tests with a simulated cutover: switch reads to the target in a controlled window while recording snapshots and an auditable trail; measure real switchover time and rollback latency. Automate these tests in CI/CD so every migration template or connector change runs the same checks. Capture results as numerical risk scores (0–100) per dimension and store them in the migration orchestration app so project owners and auditors can review a repeatable evidence bundle before approval.
3) Translate technical signals into stakeholder-ready metrics and runbooks
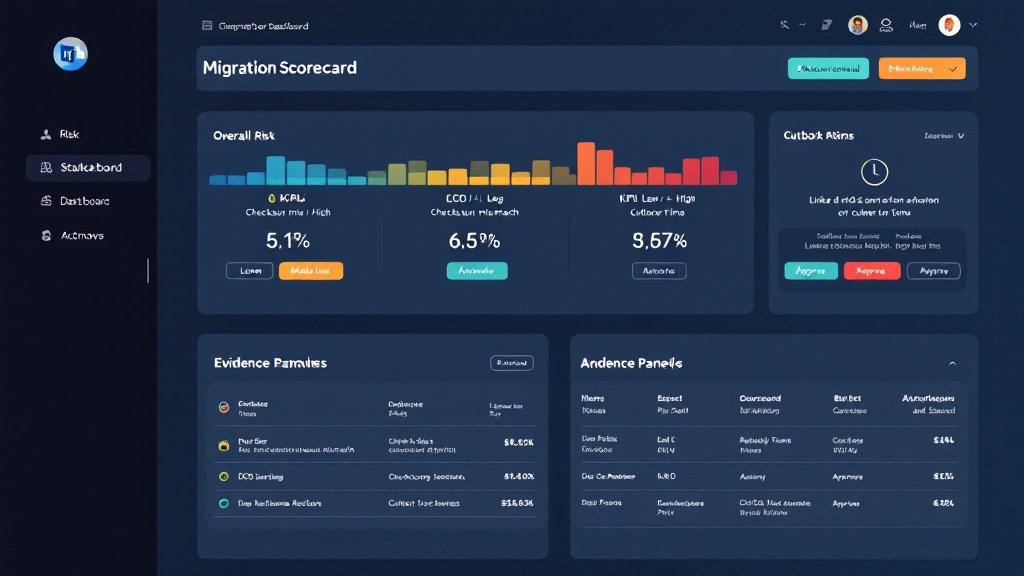
Once you have numeric indicators and test results, translate them into the language stakeholders use: business impact, likelihood, and mitigation steps. Create a concise risk scorecard per migration that includes: a headline risk rating (Low/Medium/High), numeric KPIs (e.g., 0.02% checksum mismatch, 150ms median CDC lag, estimated 90s cutover), and the potential customer- or revenue-facing impact (transactions delayed, analytics stale-window). Pair each risk item with a concrete runbook entry: when checksum mismatch > threshold, run targeted reconciliation; if CDC lag spikes beyond SLA, throttle sources or apply backfill; if simulated cutover > allowed downtime, postpone and expand CDC window.
Embed these runbooks into your migration orchestration workflow so that checkpoints require sign-off based on risk tolerance—automatically gating production cutover until green criteria are met. Produce an auditable evidence bundle (schema diffs, test outputs, snapshots) to satisfy compliance and enable confident rollbacks. By converting technical signals into clear metrics and operational playbooks, engineering and business owners can make informed go/no-go decisions and reduce migration surprises.